Does Access To Transit Impact DUI's In Los Angeles
Tools Used:
- Python
- Pandas
- GeoPandas
View a static version of the Jupyter Notebook
Final Project completed for General Assembly Python course in fall of 2019. Exploratory Data Analysis attempts to identify any correlation between the availability of Mass Transit Alternatives and the rate of DUI arrests along 6 freeway segments in Los Angeles.
The Jupyter Notebook (linked above and in the Github Repo) follows my process to clean the data, isolate relevant data points and identify additional datasets that I needed and test my hypothesis that the rate of DUI’s would be lower on freeways that parallel a Metro Rail line.
Hypothesis to Test
Segments with a Metro Rail alternative will have a lower rate of DUI incidence.
Initial Analysis
Initial analysis looked at characteristics of the dataset, such as the time distribution and differences seen when DUI Arrests were isolated from the wider dataset.
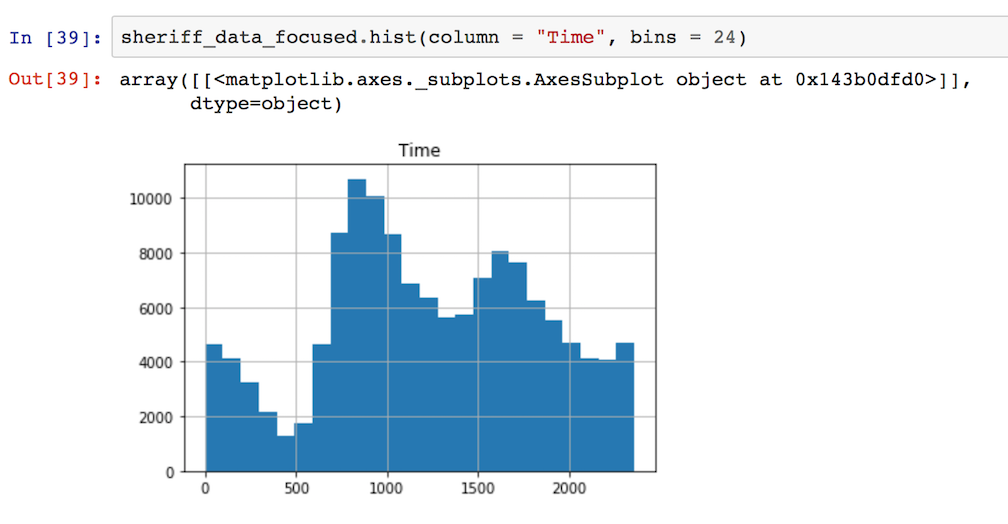
Time Distribution through the day of LA County Sheriffs Arrests
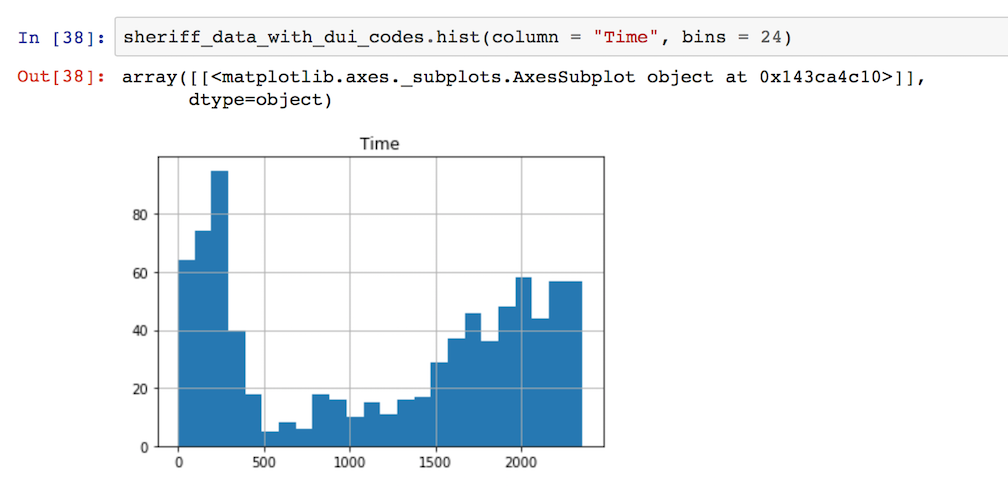
Time Distribution through the day of LA County Sheriffs DUI Arrests
Sample Conclusions:
- Distribution of arrest times in the Sheriff’s data shows clear peaks in the morning and afternoon.
- Distribution of DUI arrest times in the Sheriff’s data shows a much different pattern with a single clear peak at 3 AM.
Determining Dataset for Final Analysis
While the City of Los Angeles could conceivably be patroled by three Law Enforcement agencies, I was only able to aquire clean arrest data from two of those. The California Highway Patrol data available through the CA State data portal is mixed with reports from other agencies. At the time of this analysis, LA County was only publishing 6 months worth of data whereas City of Los Angeles publishes almost 10 years worth of arrest data. In order to decide whether to limit my scope to the six months of overlap, I looked at how many of the LA County Sheriffs DUI arrests were within the City of Los Angeles.
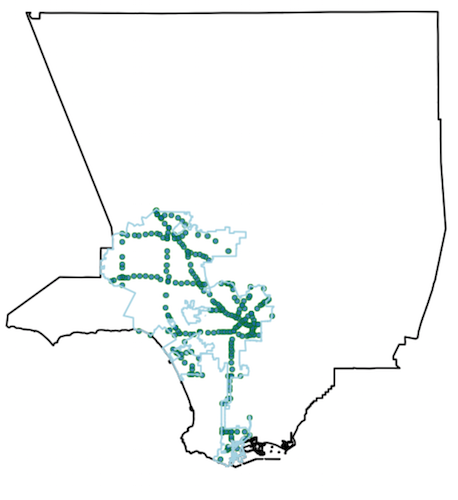
Locations of Sheriffs DUI Arrests compared to City of Los Angeles Boundary
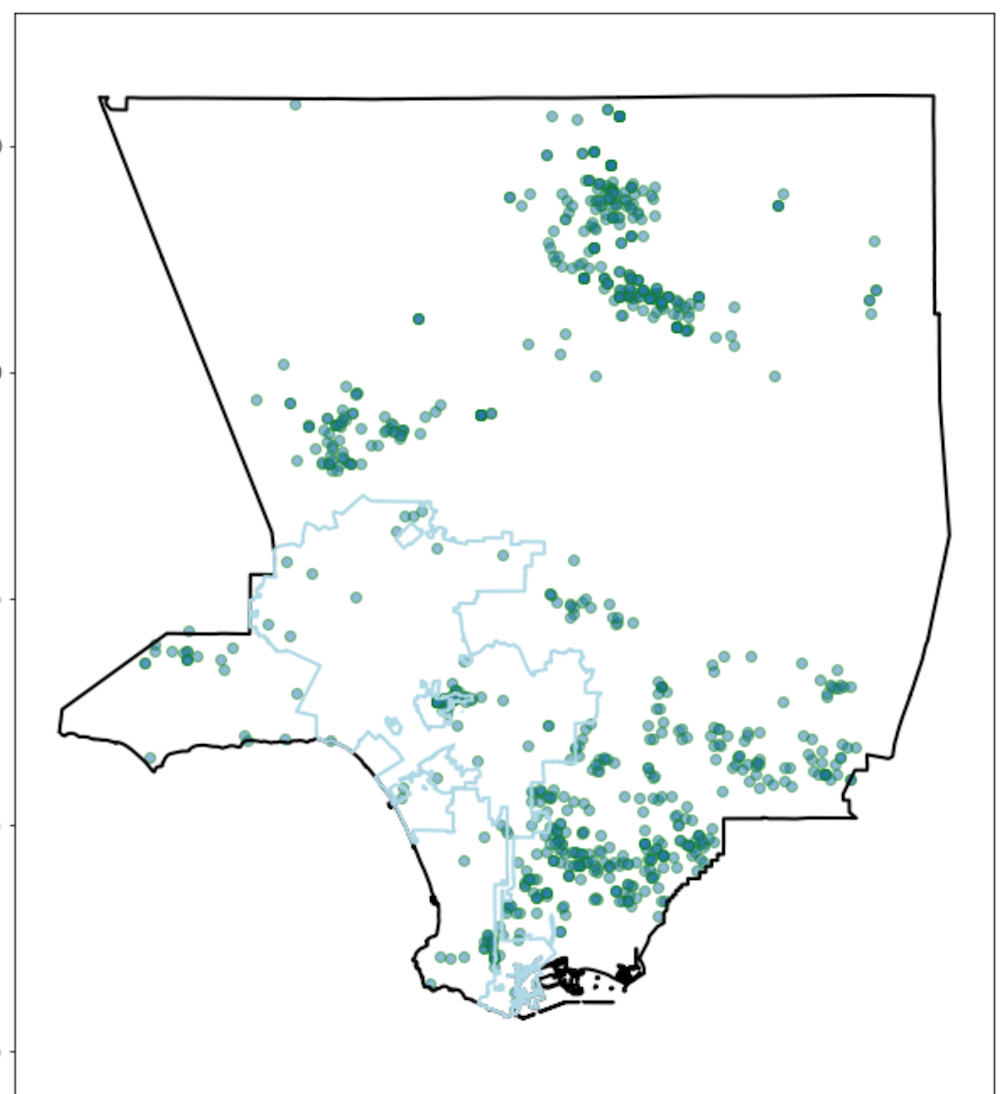
I combined the total DUI arrests within the City of Los Angeles during that 6mo period and calculated the percentage of DUI arrests that were made by LA County Sheriffs.
How much of an impact would the Sheriff’s data have?
In the 6 Months of available data LA County Sheriffs only made 39 DUI arrests within the city limits of Los Angeles. This makes sense, as they typically patrol unincorporated parts of the county.
In the same time period, LAPD made 4255 arrests within the city.
39/4255 = 0.00916
Less than 1% of DUI Arrests in the City of LA were from LA County Sheriff’s during that 6mo period
Due to the low percentage I decided to exclude the Sheriff’s data and focus on the LAPD data. This allowed me to widen the timeframe I was looking at and base my analysis on a much larger dataset.
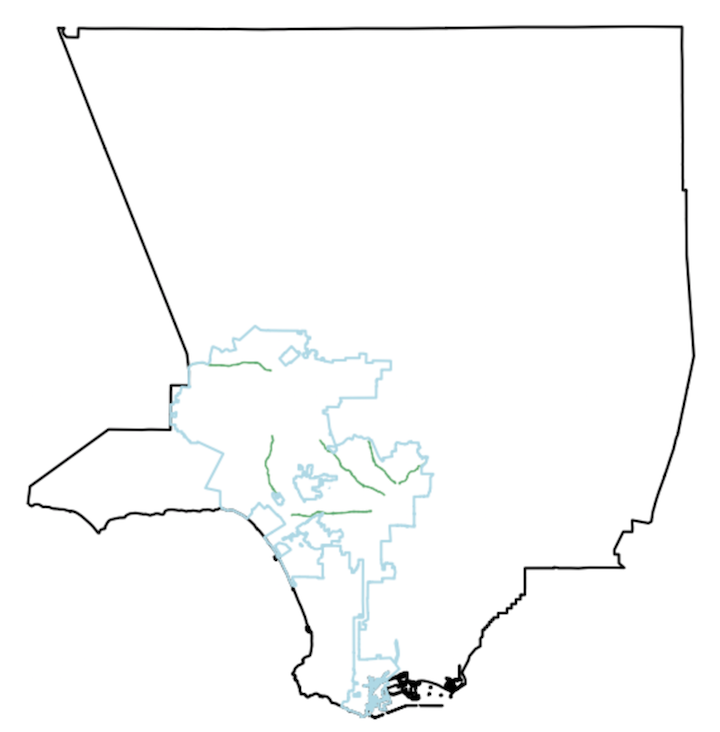
Connecting DUI’s to Freeway Segments
Freeway segments and associated ramps were selected and buffered in QGIS. Because there was not a common attribute to connect a ramp feature to a particular segment of freeway, this was the easiest path.
Freeway Segments
| Freeway Segment | Rail Alternative? | Line |
|---|---|---|
| 10 | Yes | E Line (Expo) |
| 101 | Yes | B Line (Red) |
| 110 | Yes | L Line (Gold) |
| 405 | No | None |
| 5 | No | None |
| 118 | No | None |
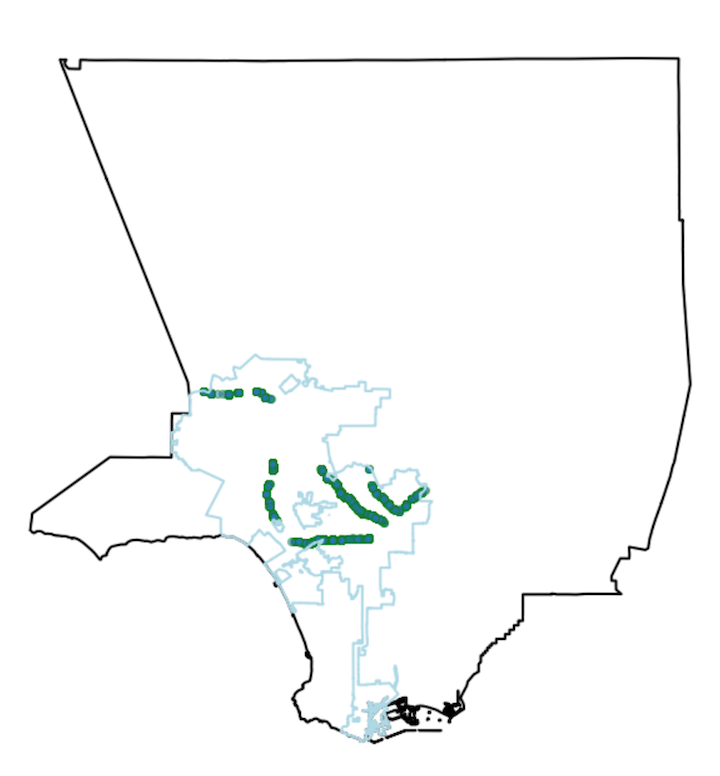
DUI’s Falling Within Buffers
Comparing DUI Incidence
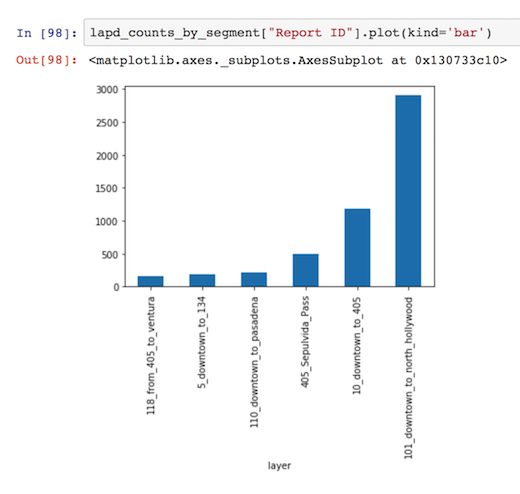
Initial Conclusions
- This is not the pattern expected, the segments with the most DUI’s are those with a rail option.
- Need to isolate other possible variables.
- Segments are not all the same length. Additionally, traffic levels may be different.
- Data needs to be normalized to ensure we are making a valid comparison
Normalizing for Traffic
AADT (Average Annual Daily Total) Traffic Counts from California Department of Transportation were brought into the analysis. The same buffers were used to select all data points that fell within a buffer and take the average.
This gives us the average number of cars traveling along that segment of freeway per day.
After converting the DUI data into a rate of DUI’s per 1000 cars.
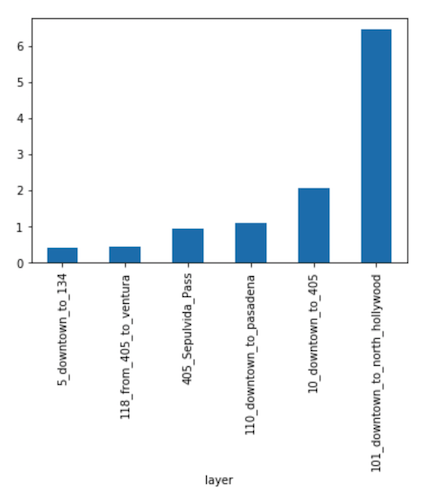
With the data normalized, the three freeway segments with rail alternatives all have the highest rate of DUI arrests.
Conclusions
- Based on the normalized data, the initial hypothesis must be rejected.
- The correlation between high DUI’s and Rail, might indicate that similar factors contribute to them. * For example, population centers that contribute to DUI’s would also be a factor in transit funding.
Questions for Future Analysis
- Does a new Metro Line influence the rate of DUI’s when it opens?
- What is the distribution of DUI’s in Los Angeles?
- What are the trends in DUI incidence and distribution over time?