Portland Pastry 10K Walk
Contents:
Data Digitization
Basemap Styling in Mapbox
Leaflet Map Development
Event Day
Takeaways
Tools Used:
- Q-GIS - Open Source Geographic Information System
- Mapbox - Platform for hosting custom basemaps styled from Open Streetmap data
- Leaflet - Light weight javascript library for building web-maps
- GitHub Pages - Simple web hosting option
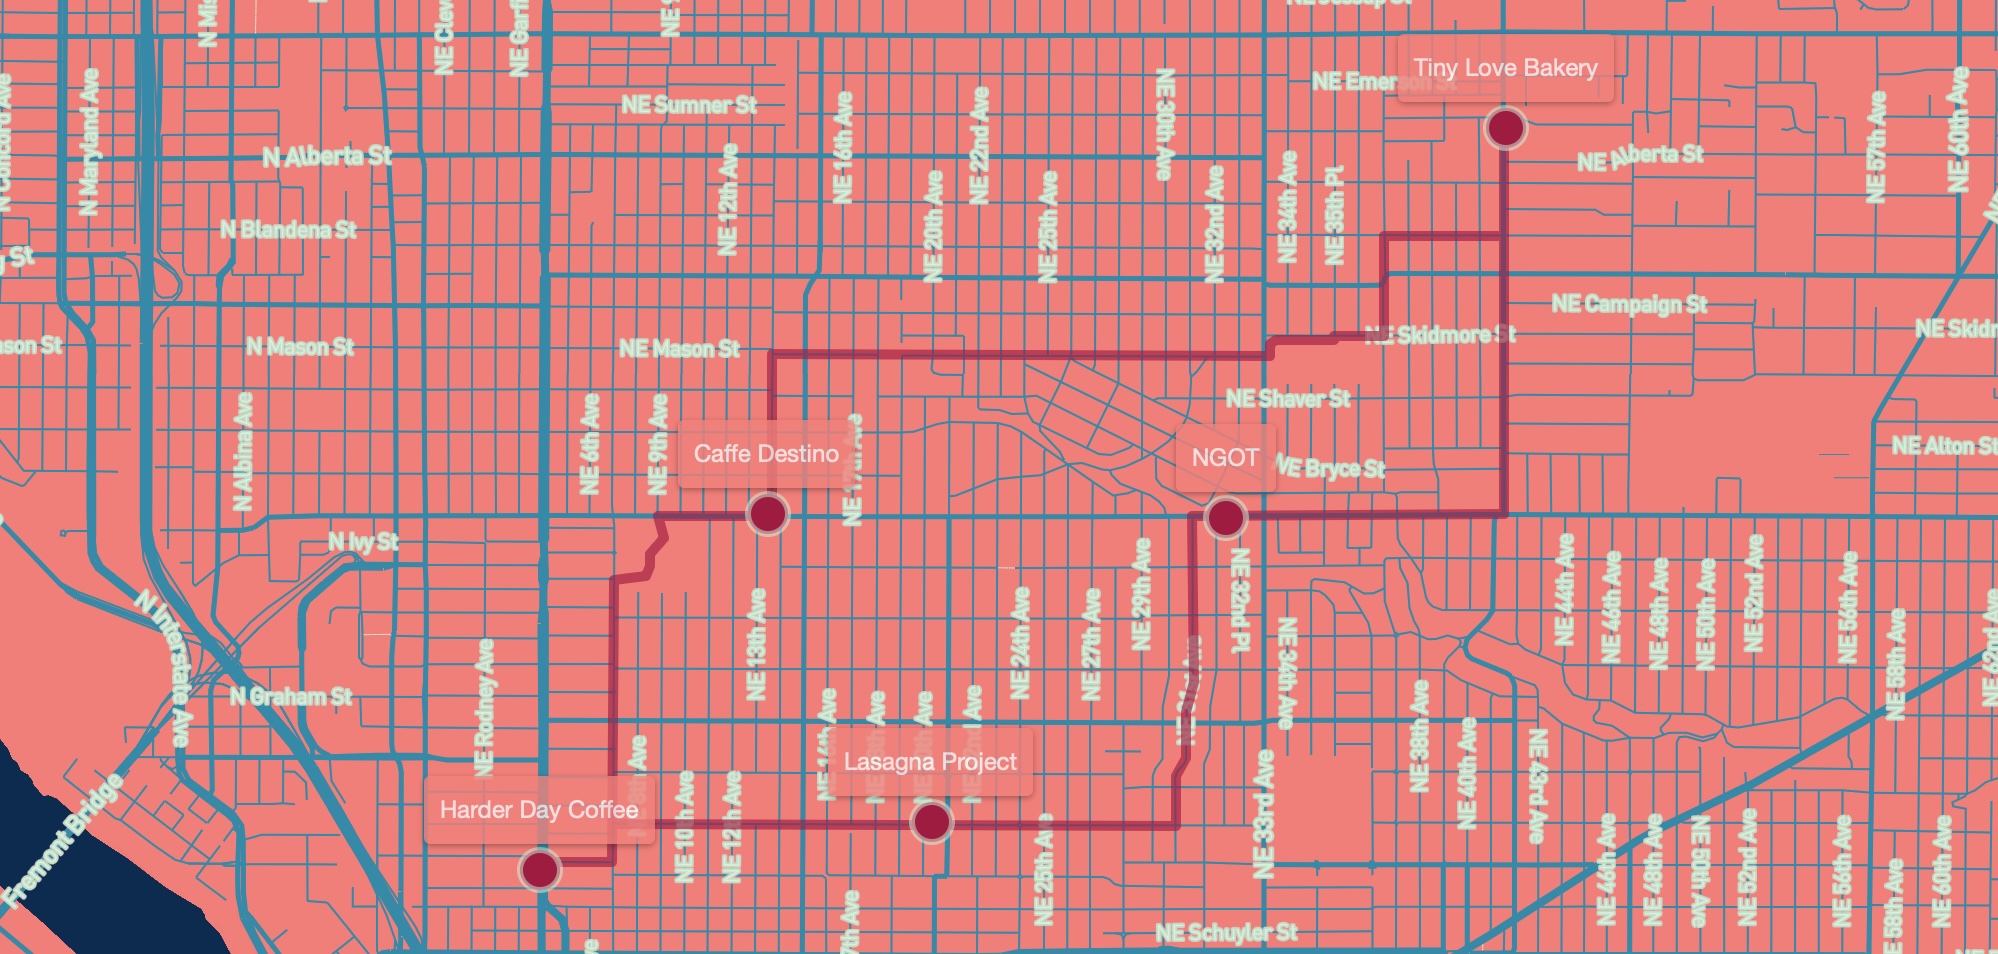
I developed this interactive webmap to support a commumity event called the Portland Pastry 10K.
This grassroots event organized a 10K walk to foster community in Portland Oregon and support local small businesses.
The map I developed:
- Coordinates with the event branding.
- Allows participants to easily reference their current position and the intended route.
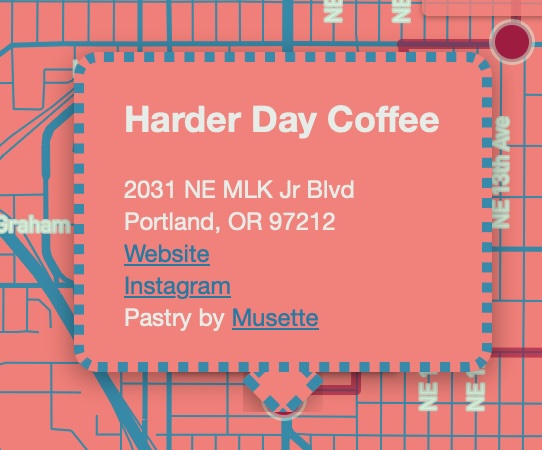
- Provides details on participating businesses in pop-ups.
- Social Media links for all.
- Physical addresses for permanent brick and mortar locations.
Data Digitization
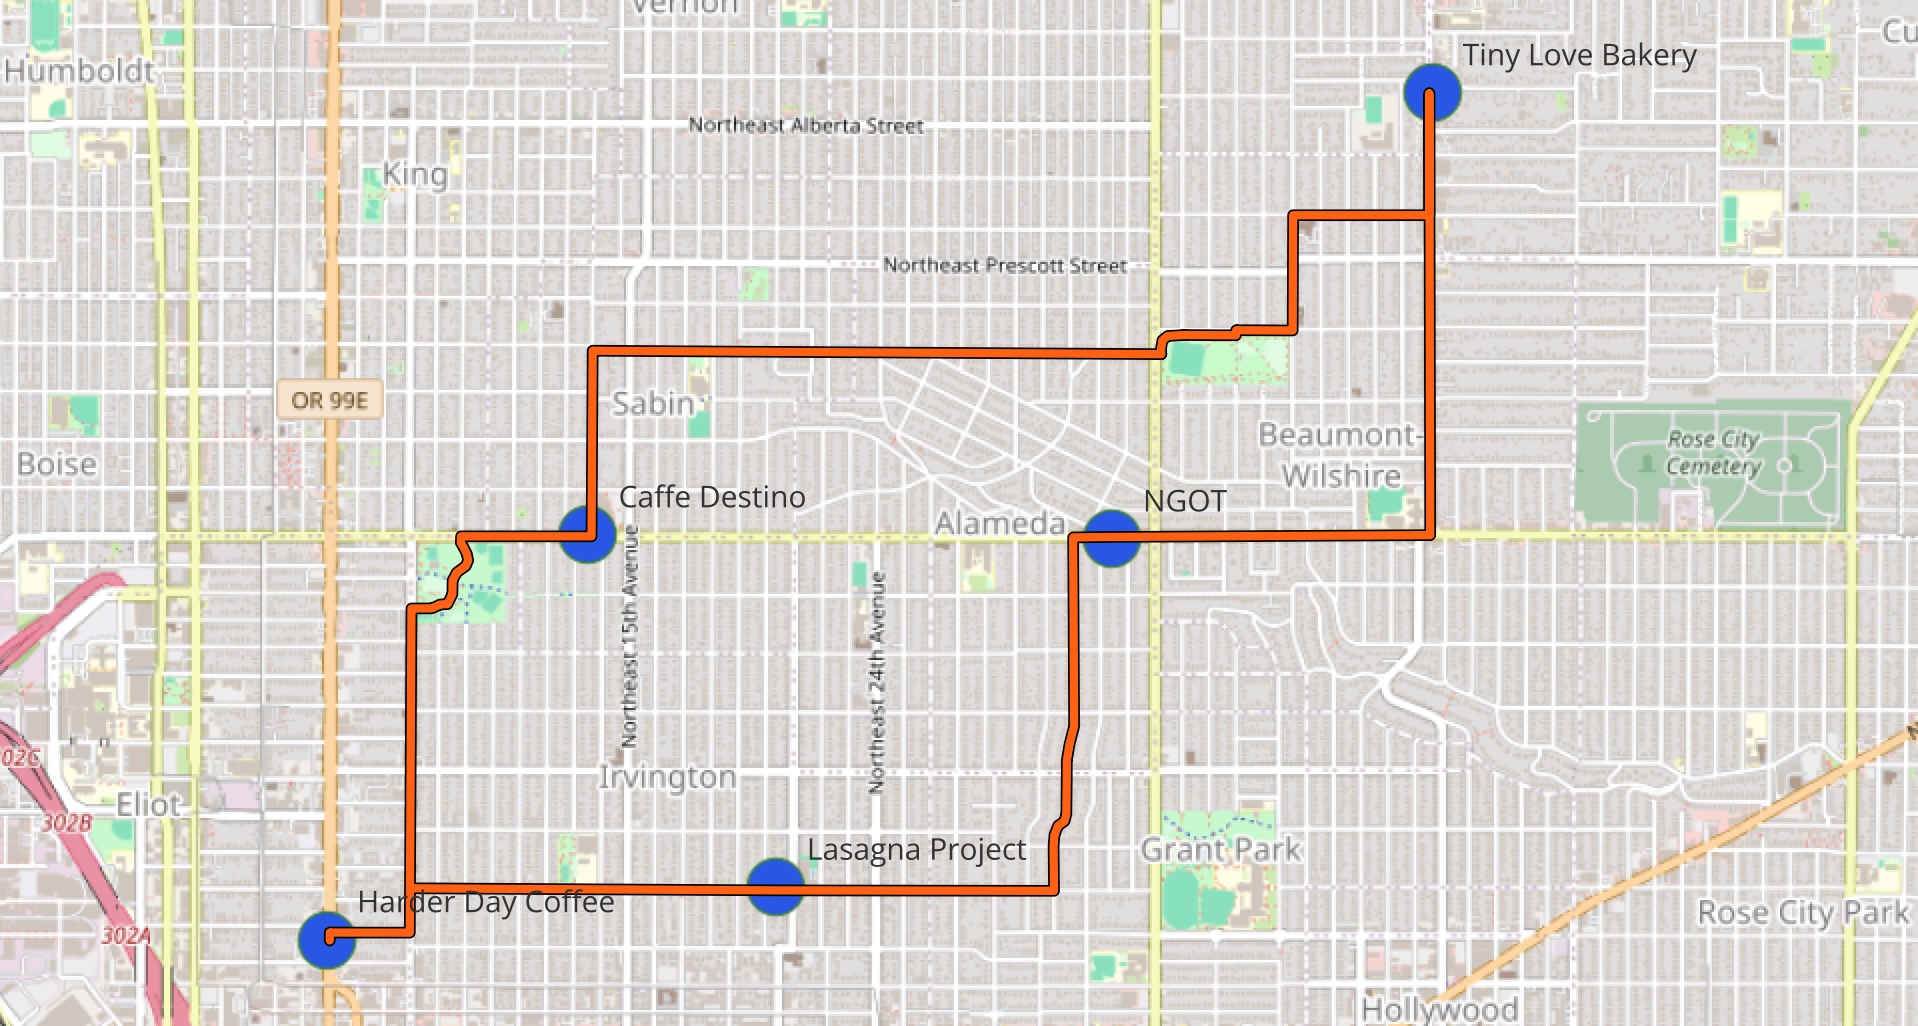
I used QGIS to digitize route and vendor data.
This method was ideal for a number of reasons:
- Ease of export of data to Geo-JSON.
- Able to ensure that data projection matches map projection.
- Granular control of data attibute fields.
Data Manipulation in Q-GIS
Attribute Manipulation in Q-GIS
Color Choice
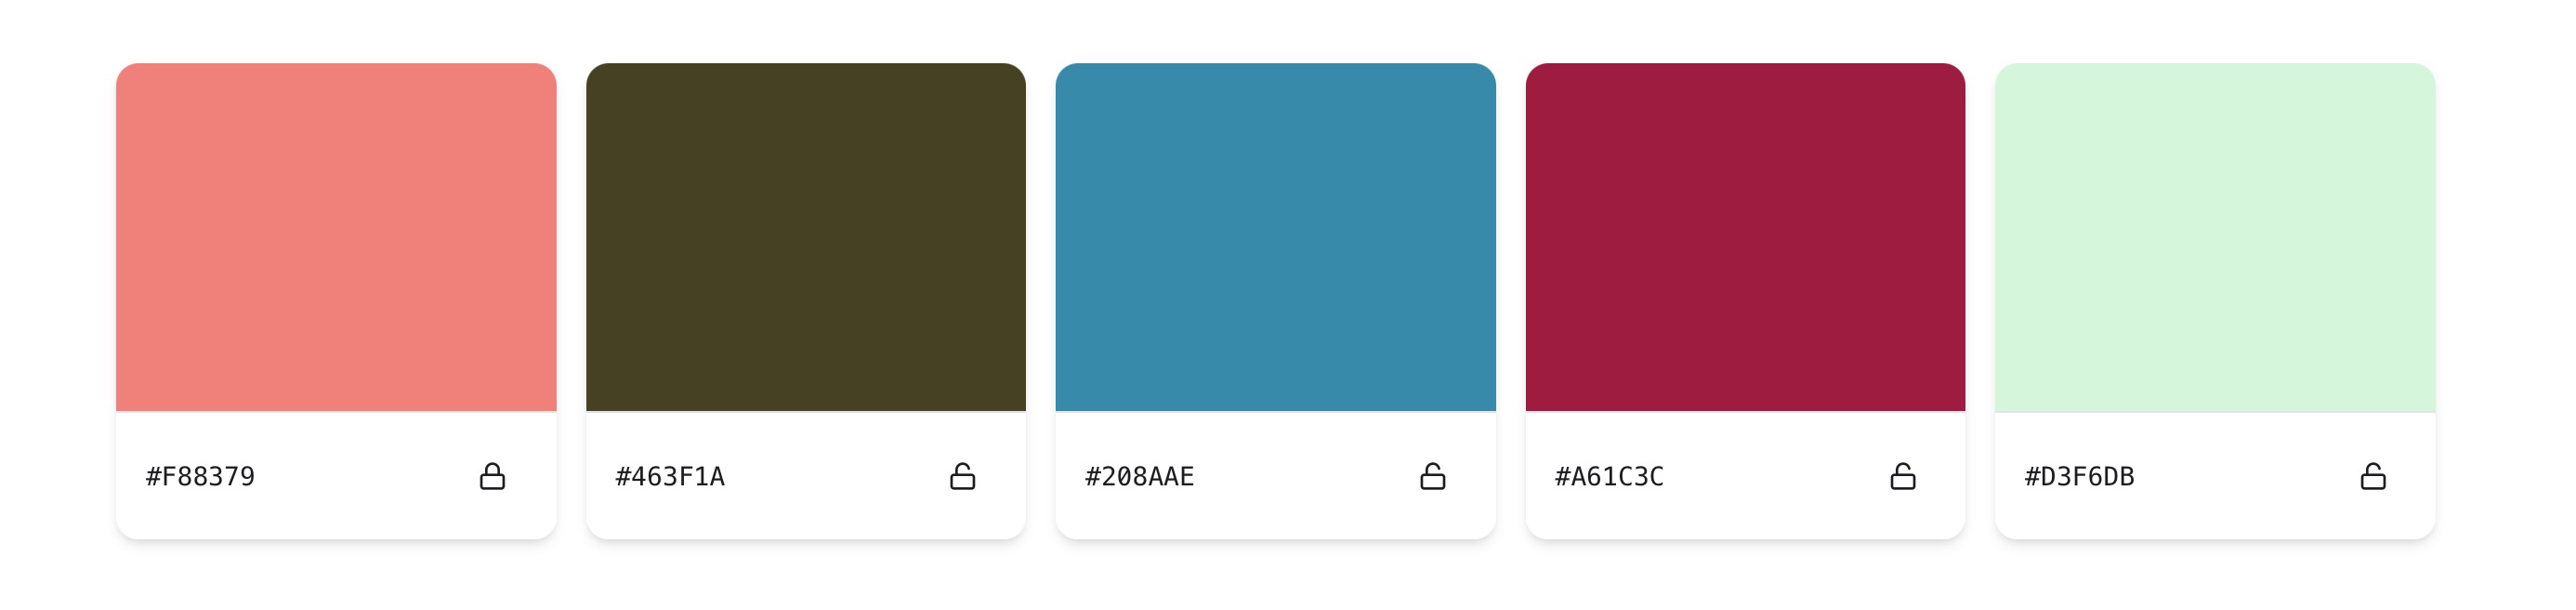
The information provided by the organizers told me that Salmon was going to be the primary color for the event’s materials.
I knew that I would need complimentary colors in order to style the map in a way that would be both pleasing and ledgible.
I used a Color Palette Generator to assemble a group of colors that would compliment that primary color, while providing highlights or contrast as needed.
Pastry Map Color Palette
Basemap Styling in Mapbox
Because I wanted all aspects of the map to fit with the event branding, I needed a way to create and host my own custom basemap.
After reviewing their plans, I confirmed that my expected usage would fall well within the Mapbox Free Tier.
Feature Prioritization
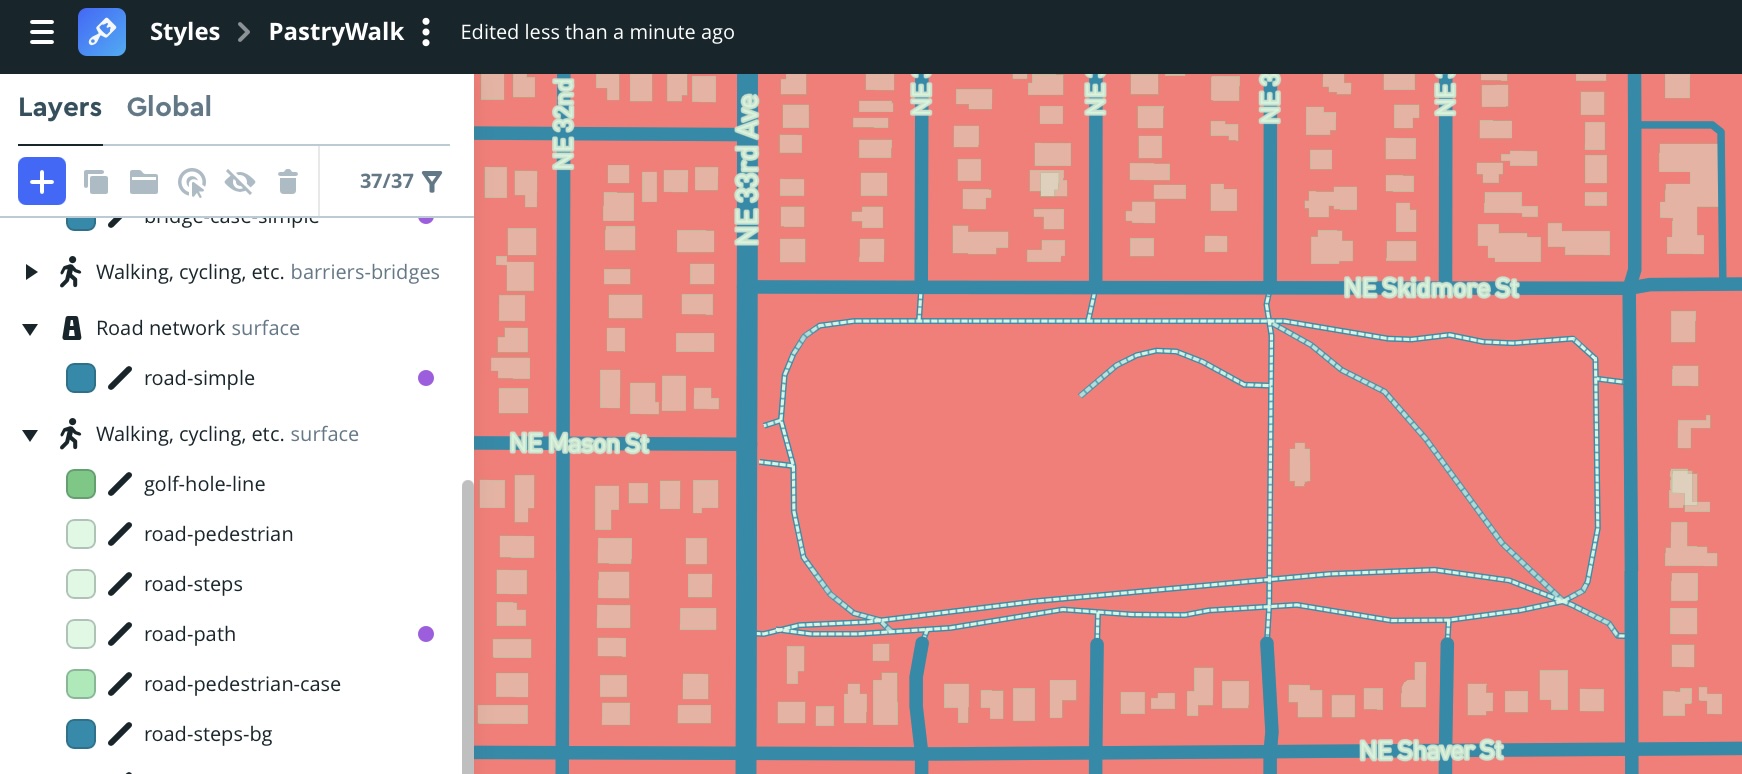
I made sure that my styling focused on local streets and paths that would be the most relevant features for participants.
Salmon made sense as the primary background color, to fit with the event branding.
I used other colors from my palette to ensure that streets, paths and labels would complement the salmon background.
Feature Styling
I configured the styling for prioritized features through Mapbox Studio.
Leaflet Map Development
Hosting
Based on the scale of the event and the expected usage, I was comfortable that Github Pages would be adequate to serve as a hosting service.
Basemap Integration
Accessing the custom basemap that I configured through Mapbox requires a private key token. I knew that this would be deployed to Github Pages and the token would be visible, so I invested time in making sure it was managed in a secure way.
The Github Pages deployment uses a specific key that I setup to only work for requests from the Github Pages URL. This ensures that even though the key is publicly visible it is not useful for any other purpose.
For local development, I used my account’s default token.
I stored the token in a separate file and added it to gitignore.
Once set up, I could push code changes without exposing the default token.
Data Integration
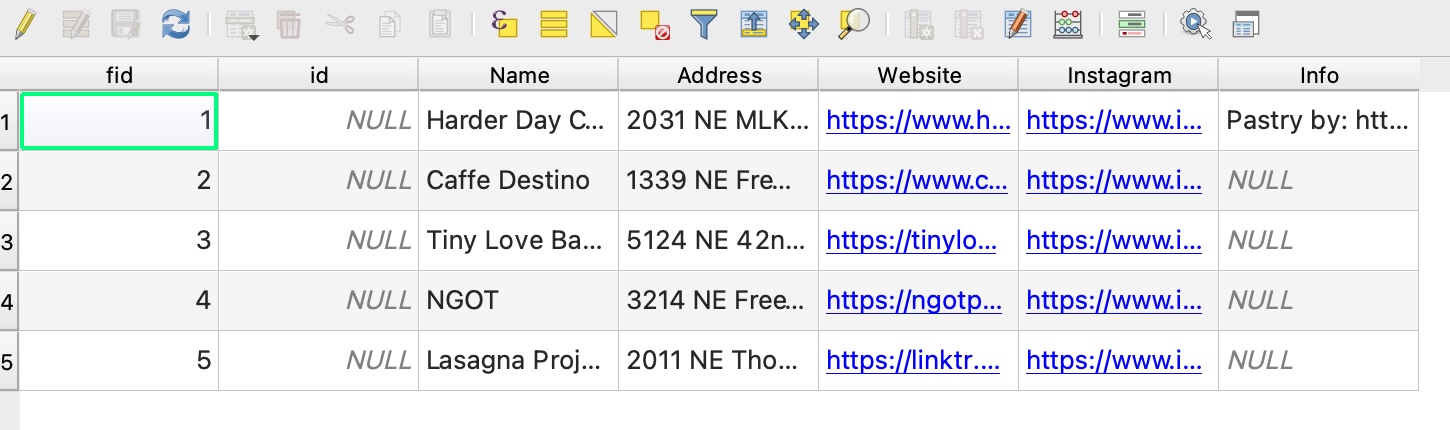
I exported the data from QGIS in two GeoJSON files.
One contained points for the stops along the route and attributes of the vendors. The other contained a line marking the route.
I started to load the files into Leaflet using a structure modeled on older webmap projects I built.
Due to new browser restrictions on loading local files the data was blocked and I had to find a new solution.
In the end, I stored the GeoJSON text as variables in two javascript files and imported the variables into memory when the page is loaded.
Custom CSS
Leaflet does not have a built in labeling function.
The best option my research identified was to use the Tool Tip function and set it to always be visible.
I modified both the Tooltip and Pop-up features with custom CSS so they would fit with the color pallate.
return L.circleMarker(latlon, 3).bindPopup(content, {'className' : 'PastryPopUp'})
        .bindTooltip(label, {className: 'PastryToolTip', permanent: true, opacity: 0.8, offset: [0,30], direction: 'center'});
        }
The classes referenced above are imported into index.html from local files to override portions of the Leaflet CSS.
Attribute Filtering
Some participating vendors do not have brick and mortar storefronts.
To avoid confusion, I wanted to show the location where they were distributing but not the address.
Similarly, the pastry baker at the starting location has a separate Instagram from the coffee shop. I stored this in an “Info” field in the point attributes, but other locations had this field blank.
To prevent “Null” from being displayed when one of these attributes is not populated for a location I built some javascript functions.
function getinfo(input) {
        if (input.properties.Info == 'null'){
            return ''
        } else {
            return input.properties.Info
        }
    }

    function getaddress(input){
        if (input.properties.Address == 'null'){
            return ''
        } else {
            return input.properties.Address
        }
    }
The functions retrieve the contents of a field for the selected feature and check whether the response is null.
If the field is null, an empty string is returned rather than the attribute.
An opportunity for future optimization would be to consolidate these into a single function that specifies the attribute to query in a parameter.
Event Day
The event organizers incorporated the QR Code I provided them into the brochure that participants received while checking in.
This allowed people to easily pull the map up on their phone and follow the route or check their location.
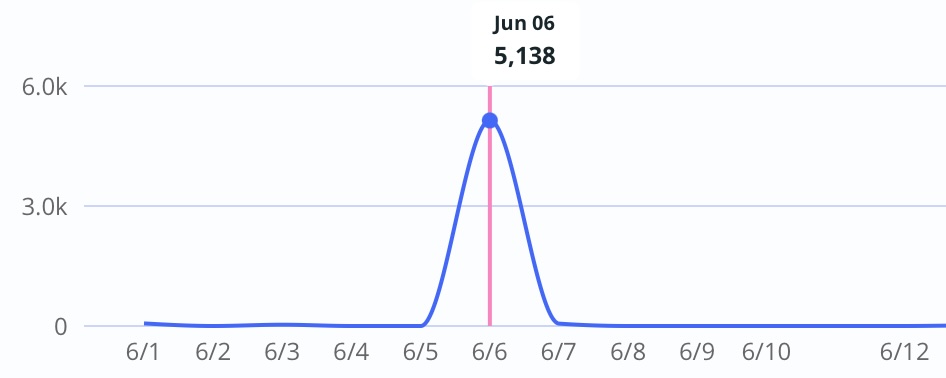
Based on the number of map tiles served by Mapbox on the event day, people made good use of it.
Takeaways
I pursued creating this map because I was looking for opportunities to get back into hands on development while also contributing to a worthwile event.
In order to accomplish my vision for the project I had to:
- Adapt to new browser standards
- Learn how to write custom CSS and override defaults
- Understand the event organizer’s vision and how to build on it
If you’re building something similar or have ideas about additional functionality that would serve an event like this, reach out. I’d be happy to connect and discuss your ideas.
-->